
25-landfill-recycle-center
Asset valuation: $2,400,000,000. Stationary Landfill Mining and Resource Recovery Facility - Price: $50,000,000 - Status: Complete Engineering Package - Author: Christopher Gabriel Brown - Date: March 2026 - Patent Portfolio: Consolidated utility application 19/540,453 (filed 02/13/2026)
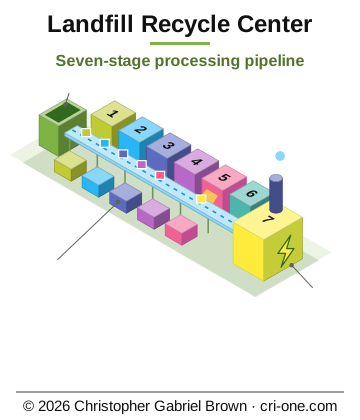
Think of a closed landfill the way a miner thinks of an old hillside: everything ever thrown in is still there, and most of it is worth more sorted than buried. The Landfill Recycle Center is the fixed-site plant that does the sorting. It takes one thousand tons of excavated landfill a day through seven stages of equipment already on the market - trommel screens, magnets, eddy-current separators, density splits, near-infrared optical sorters, a manual quality-control line with balers, and a thermal unit that turns what cannot be recycled into electricity. Out the other side come baled metals, plastics sorted by resin, glass cullet and aggregate, recovered soil, and more electricity than the plant uses.
This is the permanent cousin of the mobile-truck idea: a concrete pad instead of a weight limit, one facility permit instead of a permit per stop, and ten to fifty times the throughput. It puts up to 65.4 percent of the input back into commerce, keeps eighty-five to ninety-five percent of it out of the ground, and runs with a crew of fourteen in autonomous mode.
It is for landfill owners, waste-to-energy operators and the engineering buyers who build for them. What ships is a ready-to-permit package: every formula worked through, dimensional drawings, a bill of materials of more than eighty line items from named manufacturers, the energy-recovery thermodynamics, a three-scenario business plan, a federal, state and local permitting guide, and a working Python control-system simulator. The design is patent pending, and the inventor keeps the rights to seek further protection.
Description
Patent status: Consolidated utility application 19/540,453 (filed 02/13/2026). Patent pending; all rights to seek additional patent protection are expressly reserved by the inventor.
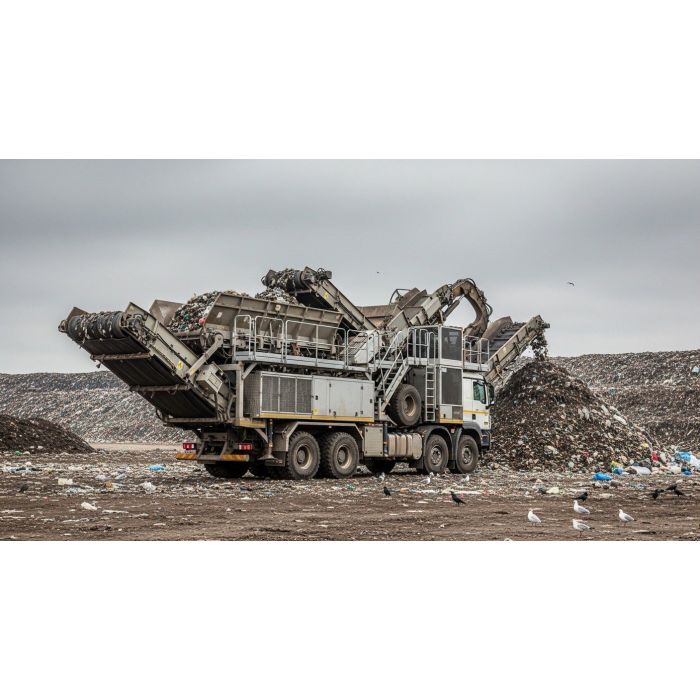
A fixed-site industrial facility that mines closed or active landfills, separates materials into saleable commodities, recovers energy from non-recyclables, and produces clean water. Unlike a mobile-truck concept (Project 15), this is a permanent processing center with full-scale industrial equipment, no weight constraints, and 10–50× the throughput. The design basis is 1,000 tons per day of excavated municipal landfill feedstock, processed through a seven-stage pipeline of commercially proven equipment — trommel screening, magnetic separation, eddy-current separation, density separation, NIR optical sorting, manual QC, and thermal waste-to-energy — producing baled metals, sorted plastics by resin, recovered soil and aggregate, and net-positive electricity.
The package delivers a complete, ready-to-permit engineering blueprint: technical specifications with every formula worked through, facility layout with dimensional drawings, a full bill of materials quoting 80+ line items from named manufacturers, an energy-recovery thermodynamic analysis, a business plan with three-scenario sensitivity modelling, a regulatory-compliance and permitting guide covering federal, state and local requirements, an autonomous-operations architecture targeting 90%+ unmanned running, and a working Python SCADA / control-system simulator.
Minimum site area 25.0 acres (processing hall 3.5 ac, feedstock staging 4.0 ac, recovered-materials storage 2.5 ac, thermal unit 1.5 ac, water treatment 1.5 ac, internal roads 3.0 ac, admin/parking 1.5 ac, buffer/setback 7.5 ac)
Processing hall 200 ft × 600 ft clear-span — 120,000 ft² (2.75 acres), 60 ft eave height, pre-engineered metal building
Thermal processing building 150 ft × 100 ft — 15,000 ft², 8‑inch CMU walls to 12 ft, insulated metal panel above
Administration building 60 ft × 80 ft — 4,800 ft² (offices, QC lab, break room, locker rooms, IT/server room)
Maintenance shop 60 ft × 80 ft — 4,800 ft² (two drive-through bays, welding area, parts storage)
Electrical service 12 MW capacity, redundant feeders, 13.8 kV primary stepped to 4,160 V and 480 V
1. Receiving & Trommel Screening Rotating drum screens, three-zone (25 mm / 150 mm apertures) Doppstadt SM 720.2 (2 units), Lindner Urraco 75DK shredder, McCloskey R230 scalping screen 120–160 TPH combined 355–445 kW
2. Magnetic Separation Overhead suspended electromagnet + drum magnet (two-stage) Eriez SE‑7 / CP‑30 suspended magnet, Eriez RE7 / Steinert UME drum magnet, Eriez Xtreme head pulleys 60–80 TPH 31–35 kW
3. Eddy Current Separation Eccentric-pole rotor at 3,000+ RPM Steinert EddyC FINES (2 units), Bunting eFines ECS, Eriez RevX‑E 40–60 TPH 52–53 kW
4. Density Separation Zig-zag air classifier + sink-float tank Westeria Windshifter ADS‑2000 (2 units), BRT Hartner Autosort 6F ballistic separator, Outotec HMS drum 40–60 TPH (air) / 15–25 TPH (sink-float) 156–211 kW
5. Optical / NIR Sorting Near-infrared spectroscopy + visible camera + AI robotics TOMRA AUTOSORT 5 (2 units), Steinert KSS XT FLI (XRF), Binder+Co CLARITY (glass), ZenRobotics ZRR2 (2 units, 80 picks/min per arm) 4–10 TPH per unit 157–217 kW
6. Manual QC & Baling Elevated picking line (8–10 stations) + horizontal auto-tie balers Machinex MACH Sort conveyor, Bollegraaf HBC‑120S baler (120‑tonne ram), Sierra International RB6000 two-ram baler, CP Manufacturing can densifier 5–10 TPH (picking), 8–12 bales/hour 90–108 kW
7. Thermal Processing (WtE) Moving-grate stoker or fluidized-bed combustion + HRSG + condensing steam turbine Valmet BFB boiler (30 MW th ), Siemens SST‑200 turbine-generator (8 MW e ), Babcock & Wilcox SPCC + baghouse FGT, Yara/Johnson Matthey SCR 8–17 TPH (grate) / 5–12 TPH (gasifier) 395–565 kW (parasitic)
Aggregate power: Total facility consumption 1,236–1,634 kW. Gross thermal generation 1,000–2,000 kW (processing-stages document) to 13.8 MW (tech-specs large-scale scenario). Net facility power position ranges from −634 kW to +764 kW at processing-stage scale, or up to 9.9 MW net export in the large-scale configuration.
Mass Balance — 1,000 TPD Design Basis
Boiler efficiency 82% (natural-circulation water-tube, 3-pass, ~1,200 m² heat-transfer area)
Parasitic loads 0.7 MW (combustion-air fans 250 kW, FGT fans 120 kW, boiler-feed pumps 80 kW, condensate pumps 30 kW, cooling-tower fans 60 kW, ash handling 50 kW, SCADA/controls/lighting 40 kW, SCR reagent 30 kW, baghouse cleaning 40 kW)
Facility energy ratio 2.05× (energy-positive — generates approximately twice the energy consumed)
CHP potential: Combined heat and power configuration could capture 20–30 MW thermal for process-water heating, building HVAC, or adjacent industrial users, raising overall efficiency to ~41.5%.
1. Screening Equipment 5 items (Doppstadt SM 720.2 ×2, Metso CVB 2060 ×2, BIVITEC 300, McCloskey R230, BRT Hartner Star Screen) $1,980,000
2. Separation Systems 12 items — magnetic (Eriez CP‑30 ×2, Steinert UME ×2, Eriez head pulleys ×4), eddy-current (Steinert EddyC ×2, Bunting eFines), density (Westeria ADS‑2000 ×2, BRT Hartner Autosort 6F, Outotec HMS), optical/sensor (TOMRA AUTOSORT 5 ×2, Steinert KSS XT FLI, Binder+Co CLARITY, ZenRobotics ZRR2 ×2) $4,502,000
3. Conveyor Systems 7 types, 39 units total (Continental primary ×2, Fenner Dunlop transfer ×12, Martin chevron ×4, Machinex MACH Sort ×2, Superior TeleStacker ×3, Hapman drag-chain ×2, Martin belt cleaners ×14) $2,094,000
4. Thermal / Waste-to-Energy 7 items (Valmet BFB boiler, Siemens SST‑200 turbine, B&W SPCC + baghouse, Yara SCR, ABB/Sick CEMS, Magaldi ash conveyor, Vecoplan VEZ 3200 RDF shredder) $12,655,000
5. Material Handling 7 items (CAT 966M ×2, CAT 336 GC, JCB 940‑4 ×2, Toyota 8FBN30 ×3, Konecranes CXT crane, CAT G320D grapple ×2, Bobcat S770 ×2) $1,907,000
6. Baling & Compaction 5 items (Bollegraaf HBC‑120S, Sierra RB6000 two-ram, CP can densifier, Tama Lastic bale wrapper, Bollegraaf bale conveyor) $1,315,000
7. Water Treatment 7 items (Highland Tank leachate EQ, Pall Aria MBR, Dow FilmTec RO, GSE HDPE liner, Highland OWS‑100, Grundfos chemical dosing, Andritz screw press) $1,762,000
8. Controls & SCADA 7 items (Siemens WinCC V8.0 redundant SCADA, Siemens S7‑1500 PLCs ×8, ABB MNS iS MCCs ×3, ABB ACS580 VFDs ×30, Axis P3265 cameras ×24, Cisco IE‑4010 switches ×6, Siemens SITRANS belt scales ×6) $1,570,200
9. Safety & Fire Protection 7 items (Honeywell NFS2‑3030 fire alarm, Viking VK500 sprinkler, Chemguard AFFF, GreCon spark detection ×8, Haws 8300 shower stations ×6, Draeger Polytron 7000 gas detection ×10, Pilz PSENmlock safety system) $869,200
10. Weigh Bridges 4 items (Mettler Toledo VTC221 truck scales ×2, ScaleMate software ×2, MobyDick wheel wash) $456,000
11. Dust Control 5 items (Donaldson Torit DLM baghouse ×2, BossTek DB‑60 ×4, Nordfab ducting, BossTek Fusion mobile, Thermo Fisher TEOM stations ×3) $892,000
12. Buildings & Structures 9 items (Nucor processing hall 3,200 m², Nucor WTE building 750 m², Butler admin 600 m², Machinex sorting cabins ×2, ClearSpan storage bays ×4, Justrite chemical storage, Butler workshop, ModSpace gatehouse, civil works) $6,840,000
All values corrected to 7% O 2 , dry basis, standard conditions (0 °C, 1 atm). APCD train: furnace → HRSG → spray-dryer absorber (hydrated lime) → activated-carbon injection → pulse-jet baghouse (PTFE membrane bags, ~2,000 bags, 2,000 m² filtration area) → SCR reactor (V 2 O 5 ‑WO 3 /TiO 2 honeycomb, >80% NO x reduction) → ID fan → 200 ft stack (6 ft inside diameter). CEMS monitors CO, NO x , SO 2 , HCl, O 2 , PM, Hg, temperature, and flow continuously, with data logged per EPA 40 CFR Part 60.
Regulatory framework covered in full: RCRA (40 CFR Parts 239–282), Clean Air Act Title V, NSPS Subpart Eb, MACT Subpart EEE, NPDES (40 CFR Part 122), pretreatment (40 CFR Part 403), NEPA (40 CFR Parts 1500–1508), OSHA (29 CFR Part 1910 — 14 specific standards addressed including HAZWOPER, LOTO, confined-space, noise exposure, machine guarding, hazard communication), 10 safety programs documented, permitting timeline 18–36 months, permitting costs $542,000–$1,070,000, annual compliance $335,000–$515,000.
CAPEX: $42,500,000 (range $40M–$45M). Discounted payback (10% rate): ~9.2 years. 15-year NPV: ~$17.6M. Project IRR (base case, 15-year horizon): ~14%.
Autonomous Operations Architecture
Target: 90%+ autonomous operation with a staff of 14 people running a 1,000 TPD facility (versus 45–60 at a conventional MRF). Annual labour cost: $910,000 (14 staff × $65,000 average fully loaded).
System Technology Key Specifications
Primary optical sort TOMRA AUTOSORT (3 units in series) NIR spectrometer at 320 scan lines/second + VIS camera, 2,000 mm belt at 3 m/s, 256 pneumatic nozzles at 6 bar, 95%+ detection accuracy, 90–95% ejection purity
Robotic QC AMP Robotics Cortex (2 units) AI vision, delta-robot arm at 80 picks/minute, self-learning accuracy improvement, 5 kW per unit
Master PLC Allen-Bradley ControlLogix 5580 EtherNet/IP backbone, 8 remote I/O racks (AB 1756‑EN4TR)
SCADA Ignition by Inductive Automation Redundant Dell PowerEdge R750 servers, web dashboards, mobile push-notification alarms, 10+ year historian, multi-site support
HMI panels AB PanelView 5510 (22′′) 4 units at local stations
Network Cisco IE‑4010 industrial switches (6 units) 1 Gbps EtherNet/IP, OPC-UA for SCADA-to-PLC, VPN remote access
UPS Eaton 9PX 6 kVA (2 units) Control-system backup power
Phase 2 roadmap: autonomous wheel loader (Volvo LX04 / CAT autonomous), AGV bin transport, predictive maintenance via ML on vibration/temperature data, dynamic sort recipes driven by real-time commodity pricing, autonomous excavation (Built Robotics).
Recycling rate: 57.7% (180,000 GPD closed-loop). Net fresh-water consumption: 132,000 GPD. On-site treatment: 20 ft diameter clarifier, sand filter, pH adjustment, RO system (Dow FilmTec BW30, 5 GPM for boiler makeup). Zero process-water discharge to surface water — all to POTW or recycled.
Nighttime (10 PM–7 AM) residential 45–55 dBA 48 dBA continuous Marginal — loader operations restricted at night
OSHA workplace 8‑hr TWA 90 dBA 85–95 dBA by area Hearing protection required in shredder/air-classifier zones
Building-shell TL: 25 dB (R‑19 insulated metal panels). Distance attenuation to 200 ft setback: 36.5 dB. Combined continuous boundary noise: 47.6 dBA. Mitigation: acoustic enclosures on shredder (15–20 dB reduction), inlet/outlet silencers on air-classifier blower, 8 ft barrier wall on cooling tower, earthen berm along residential boundaries (5–8 dB insertion loss).
Classes FacilityController, ProcessingStage (base), ReceivingTipping, PreSort, MechanicalSeparation, OpticalSorting, MaterialProcessing, ThermalProcessing, ResidualsManagement
Data classes Alarm, Sensor, MaterialStream (with total property and scale() method)
Enumerations StageStatus (RUNNING, STOPPED, FAULT, MAINTENANCE), AlarmSeverity (INFO, WARNING, CRITICAL)
Simulation features 7-stage sequential material-flow processing, per-component energy balance, sensor simulation with noise, stochastic fault injection (0.2% per timestep), alarm management with severity grading, auto-restart attempts, CSV data logging, text-based SCADA dashboard
Thermal model First-law energy balance: Q in = ṁ × LHV, boiler efficiency 82%, Rankine-cycle 29.6%, combined generator efficiency 94%, parasitic-load subtraction
Feed composition model Plastics 18%, paper 22%, ferrous 5%, non-ferrous 2%, glass 5%, organics 15%, textiles 8%, wood 6%, residuals 19% — ±10% variability per timestep
Outputs facility_log.csv with per-minute rows: timestamp, elapsed hours, feed rate, cumulative input, per-stage status/input/output/power/runtime, gross and net generation, total consumption, total recovered, total to landfill, active alarms
ASCE 7‑22 (loads), ACI 318‑19 (concrete), AISC 360‑22 (steel), NFPA 13 (sprinklers), NFPA 652 (combustible dust), NFPA 850 (generating plants), 40 CFR Part 60 Subpart Eb (large MWC), 40 CFR Part 62 Subpart FFF (federal plan), 40 CFR Part 403 (pretreatment), 29 CFR 1910.95 (noise), ASHRAE 62.1 (ventilation), CMAA Specification No. 70 (cranes), ASTM D1586 (SPT), ASTM D2850 (triaxial), ASTM E1155 (floor flatness), ISO 10816 (vibration), ISO 9613 (outdoor sound), EPA Methods 1–5, 23, 26A, 29 (stack testing), AASHTO HS‑25 (pavement loading), IBC, IFC, NEC/NFPA 70, IMC, IPC, ADA.
specs/TECHNICAL_SPECIFICATIONS.md Full engineering specifications: site requirements, processing-hall dimensions, 7-stage equipment specs with throughput and power calculations, mass balance (all 7 stages traced), energy balance, water balance (312,000 GPD process, 57.7% recycle rate), emissions and air quality (full MACT compliance table), noise analysis with logarithmic-addition boundary predictions
blueprints/FACILITY_DESIGN.md Building layout, site plan, 5-zone interior arrangement, utilities (electrical, water, gas, compressed air, fire protection), truck-traffic flow with WB‑67 design vehicle, environmental controls (negative-pressure ventilation, HEPA filtration, tipping-floor misting, enclosed conveyors, noise barriers, biofilter odour control)
blueprints/PROCESSING_STAGES.md All 7 stages documented individually: function, input parameters, equipment specs with named models, output streams, throughput rates, power consumption by component, staffing per shift, maintenance intervals per component, failure-mode analysis per stage with cause/effect/mitigation
blueprints/EQUIPMENT_BOM.md 80+ line-item bill of materials across 12 categories, each with manufacturer, model, quantity, unit cost, total cost, lead time (4–52 weeks), key specifications, and maintenance interval. Equipment subtotal $36,842,400; total installed $49,737,200
blueprints/ENERGY_RECOVERY.md Thermal-unit design (moving-grate combustion, 3-zone, 850–1,100 °C), waste-composition heating-value table, LHV moisture-correction formula, HRSG specs (3-pass water-tube, 1,200 m²), steam-turbine Rankine-cycle calculation, parasitic-load breakdown, net-export calculation, annual electricity production, APCD train specs (baghouse, ACI, SCR, SDA), full MACT compliance table with margins, ash-management plan with metals recovery from bottom ash, Sankey energy-flow diagram, first-law check, Carnot comparison
blueprints/AUTONOMOUS_OPERATIONS.md Autonomous staffing model (14 people vs. 45–60 conventional), per-stage automation architecture with named sensors and control logic, central SCADA hardware list (Allen-Bradley ControlLogix 5580, Ignition SCADA, Cisco IE‑4010 switches), network architecture diagram, control philosophy (start/stop sequence, fault handling, auto-recovery), remote-monitoring capability, autonomy metrics, Phase 2 upgrade roadmap
financials/BUSINESS_PLAN.md Full financial model: CAPEX breakdown ($42.5M across 6 categories), OPEX ($6.3M/year with per-category detail), 8 revenue streams with pricing references to ISRI, LME, RecyclingMarkets.net, 3-scenario sensitivity analysis (pessimistic/base/optimistic), discounted payback at 10%, NPV, IRR, 8 risk factors rated and mitigated, 45-person staffing plan with per-role wages
financials/REGULATORY_PATHWAY.md 11-section compliance guide: federal permits (RCRA, CAA Title V, CWA NPDES, NEPA), state permits (solid waste, air, water, utility interconnection), local permits (zoning/CUP, building, fire marshal), environmental-impact assessment scope and process, public-hearing requirements, OSHA standards (14 specific standards, 10 safety programs), 24-month master permitting schedule with Gantt chart, ongoing compliance requirements (annual reporting, inspections, CEMS), permitting-cost breakdown, regulatory-risk matrix
software/control_system.py 847-line Python 3.8+ SCADA simulator: 7-stage material-flow model, energy-balance calculation, alarm management, CSV logging, text-based dashboard — standard library only, no dependencies
software/facility_log.csv Sample output from control-system simulator — per-minute rows with 39 columns of operational data
This package ships on a single Blu-ray disc, posted to the delivery address on your order. The archive on the disc is AES-256 encrypted; the passphrase is sent separately, by email, once the disc is despatched — so the disc alone is of no use to anyone who intercepts it.
Discs are despatched by tracked, signed-for post. Allow 5 business days for mastering and verification before despatch.
© 2026 Christopher Gabriel Brown. All rights reserved.
Photo
Footnotes
- Product number 8473.
- Family: environment.
- Purchase: When you buy, you buy the use of that blueprint only.